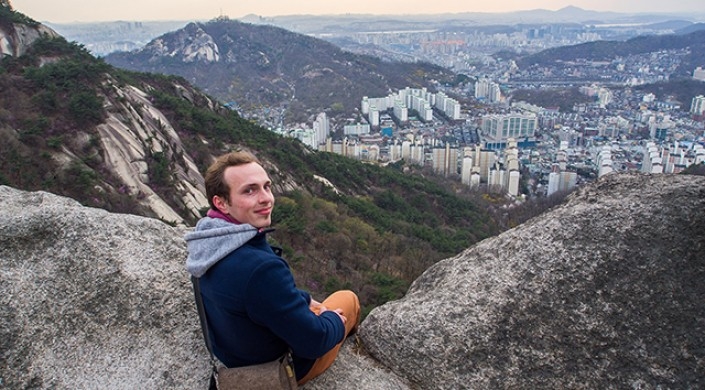
Computer science Ph.D. candidate Fritz Lekschas enjoys the view from far above the city of Seoul, South Korea. (Photo courtesy of Fritz Lekschas)
Imagine a tool that draws on vast genomic datasets and allows biologists to see how interactions between DNA influence gene regulation, in the same way that a Google Map lets the user zoom in on a street address to see what’s nearby in the neighborhood.
Scanning a map, rather than searching a dizzying genomic database, helps researchers identify and explore the interactions caused by folding DNA strands, said Fritz Lekschas, a computer science Ph.D. candidate at the Harvard John A. Paulson School of Engineering and Applied Sciences who is developing such a tool in the lab of Hanspeter Pfister, An Wang Professor of Computer Science.
The way a strand of DNA “folds,” bringing different sections into close proximity to one another, can cause interactions that may block certain genes, Lekschas explained. Using novel techniques, biologists are able to measure these interactions across the entire genome, but finding meaningful patterns among the billions of characters that make up the genome is no easy task.
The tool he co-developed in collaboration with Nils Gehlenborg’s group from Harvard Medical School lets scientists zoom in on certain interactions and compare interesting regulatory effects, like zooming in on a specific street intersection and being able to see nearby attractions, such as parks and restaurants.
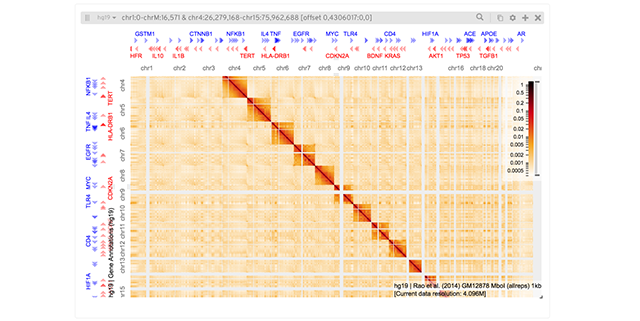
An example of the output generated by the tool Lekschas co-developed, which helps researchers identify and explore the interactions caused by folding DNA strands.
“You need a fast database that can computationally process all this information, but you need to also somehow transfer that information into a human brain,” he said.
Since it is very time-consuming to zoom in and out of thousands of locations when studying a specific local feature of DNA interaction, Lekschas created a new tool that cuts out and groups similar interactions into stacks of images to easily show anomalies in extracted patterns. He has further developed a technique that automatically places these stacks of images into a map to guide the user to areas of interest too small to be identifiable in an overview. This technique helps users see patterns they might miss if they manually zoom in and out across the map.
“This helps researchers get faster results,” he said. “You can spend a week trying to figure something out, but you are losing a lot of ideas along the way. If, instead, you can spend 10 seconds to verify a lot of hypotheses, then you are not missing out on those good ideas.”
One of the biggest challenges is dealing with such an enormous amount of data, Lekschas said. Just drawing a scaled-up version of a map doesn’t do the trick when there are billions of data inputs; the data must be meaningfully compressed so the visualization doesn’t show too many details at once.
“Another challenge is trying to abstract a biological problem into a purely data-driven and task specific problem,” he said. “What would the scientists really like to see to advance their research? There are a lot of paths to go down in terms of visualizing data that don’t really help anyone. You don’t want to end up visualizing the wrong thing.”
The work is as much art as science, and Lekschas draws on the keen eye for design he developed in his youth as he creates the visualizations.
A native of Berlin, one of his childhood hobbies was building websites to showcase the simple computer graphics he enjoyed designing. During high school he developed a passion for computation and biology that inspired him to study bioinformatics at the Free University of Berlin.
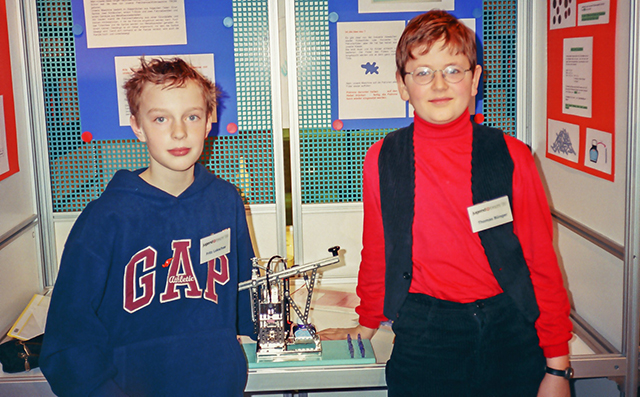
Lekschas (left) and his childhood friend Thomas Bünger demonstrate a device they created that refills fountain pens at the German Youth Science Competition. (Photo courtesy of Fritz Lekschas)
“I’ve always been interested in how we can take a fuzzy biological problem, measure it using some piece of technology, analyze it with a computer, and then translate it into something specific, like a score that tells us what is happening inside the cell,” he said.
Lekschas dove deeper into murky biological problems through a research assistantship at the Charité – Berlin University of Medicine. As the first “computer guy” in a group of wet-lab researchers, he set up tools for cataloging cellular data under the supervision of Harald Stachelscheid.
As the lab embarked on a massive project to build a unified database of cell resources, Lekschas wondered how the results could be more user-friendly. He began developing a tool that provides a visual way for users to search for data connections.
“If one cell differentiates into another cell, a human being doesn’t need a complex database to get that information into their head—you just need to draw a picture,” he said. “So I thought an interesting approach would be to have a body browser that allows you to navigate from the gross body overview, down to the individual cells, and also across developmental stages, to glue together all this abstract information into a visual interface to help you understand what is going on.”

While working at the Charité – Berlin University of Medicine, Lekschas had the opportunity to spend several months living and working in Seoul, South Korea, where he enjoyed exploring the city. (Photo courtesy of Fritz Lekschas)
Lekschas spent the next year working on the body browser, creating a visual interface with such fine detail that a user can see the specific structure of blood vessels in the liver, for instance. More than just a detailed image, the dynamic tool enables scientists to see how neighboring cells are interrelated through the development cycle and to visually explore spatial gene expression patterns.
The project taught Lekschas a great deal about collaborating with peers who have varied expertise. Juggling different aspects of such an interdisciplinary project was challenging, but it inspired him to dive deeper into research.
For his master’s thesis, Lekschas worked with Nils Gehlenborg for the first time on a project to visually explore the content of a biomedical data repository.
“We are very good at making databases faster and more efficient, but not much has changed in terms of how we make sense of the content of databases,” he said. “You type in some text into a search bar and get some results back, but that doesn’t tell you what else is in the database and if you potentially have missed something interesting. For average search queries, that might not be an issue, but for scientific databases, if you don’t know the data was there, your results could be worse, or even meaningless.”
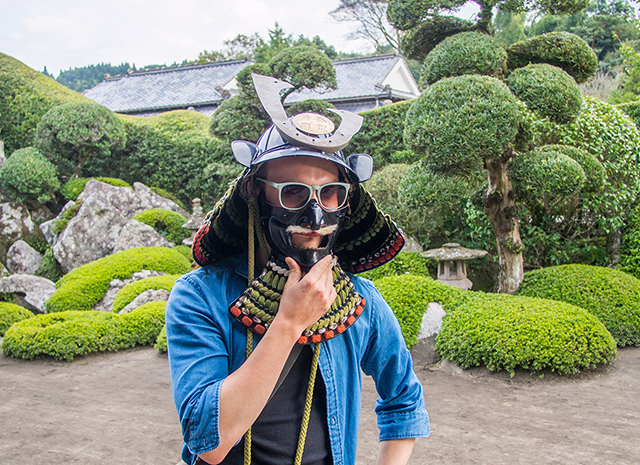
While completing his master's degree, Lekschas had the opportunity to spend a year in Japan for professional development and intercultural training, where he enjoyed learning about the local culture. (Photo courtesy of Fritz Lekschas)
While completing his master’s thesis, he attended a visualization conference where he met Pfister. Drawn to Pfister’s expertise in data visualization and his strong collaborations in biomedical research projects, Lekschas joined the lab for his Ph.D.
His projects have proven to be the perfect marriage of his skills and passions, and a rewarding outlet for this design enthusiast-turned-scientist. For Lekschas, the most gratifying moments are running user studies with researchers and hearing first-hand how the tools he develops help advance scientific discovery.
And though he is still immersed in his Ph.D., he looks forward to continuing to move that needle through a research career.
“It might sound a little cheesy, but I think I have come full circle in some sense. If I look back, I realize I was always excited about visuals, but always together with the computer. I’m not a graphic designer, but I am interested in how we can transform the vast amount of information that we have and see a pattern,” he said. “As the data grows, how can we still get insight? How can we locate the information somewhere in these data masses when we’re only human?”
Outside the lab, traveling, especially to Asian countries, is one of Lekschas' favorite pasttimes. (Photo courtesy of Fritz Lekschas)
Press Contact
Adam Zewe | 617-496-5878 | azewe@seas.harvard.edu