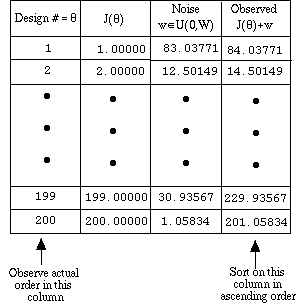
Fig. 4 Spread Sheet Implementation of Generic Experiment

Column 1 models the N (=200) alternatives and the true order 1 through
N. Column 2 shows the linearly increasing OPC from 1 through N
(= 200). The rate of OPC increase with respect to the noise variance
sigma2 essentially determines the estimation or approximation
error of ![]() . This is shown by the random noise generated in column 3
which in this case has a large range U(0,100). Column 4 display the
corrupted (or estimated) performance. When we sort on the column 4 we can
directly observe the alignment in column 1, i.e., how many numbers 1 through
g are in the top-g rows. Try this and you will be surprised!
It takes less than two minutes to setup on EXCEL or Lotus 1-2-3. Replicate
the spread sheet calculations several times to get an estimate of P(|G
intsc S| > k) = ?.
. This is shown by the random noise generated in column 3
which in this case has a large range U(0,100). Column 4 display the
corrupted (or estimated) performance. When we sort on the column 4 we can
directly observe the alignment in column 1, i.e., how many numbers 1 through
g are in the top-g rows. Try this and you will be surprised!
It takes less than two minutes to setup on EXCEL or Lotus 1-2-3. Replicate
the spread sheet calculations several times to get an estimate of P(|G
intsc S| > k) = ?.